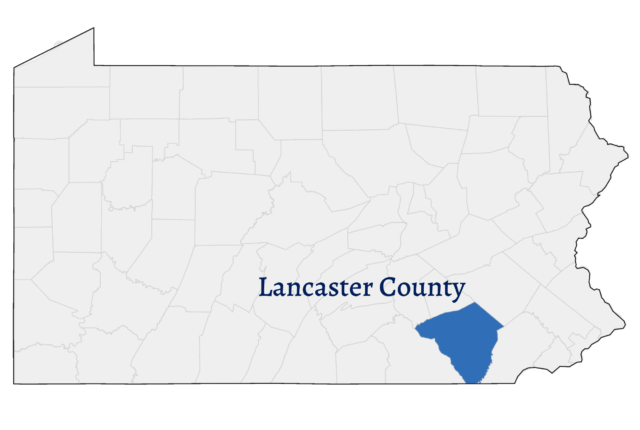
Lancaster County
Background
Lancaster County is located in the South Central region of Pennsylvania. Lancaster is one of the oldest inland cities in the U.S. and has a large Pennsylvania Dutch population. Lancaster County is a combination of rural and urban environments. The sources of environmental exposure on urban and rural populations are varied but their impacts may combine to significantly affect health in both settings.
Hazard Profile
Lancaster County does not have a county health department and relies on small community organizations, like the Lancaster Lead Coalition and the Partnership for Public Health, to promote health and prevent exposure. Lancaster is repeatedly identified as having poor air quality due to local conditions of burning wood and coal in outdoor furnaces for home heating.
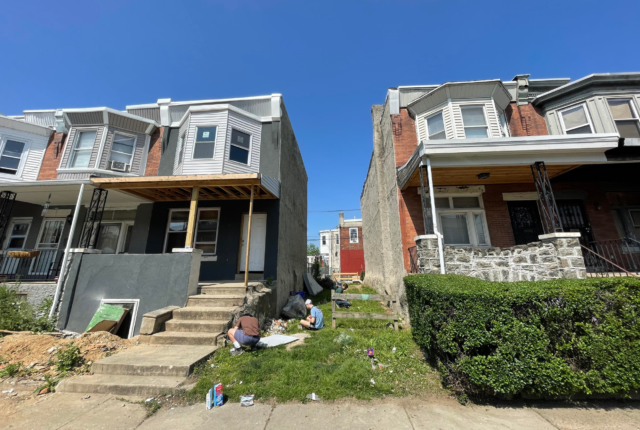
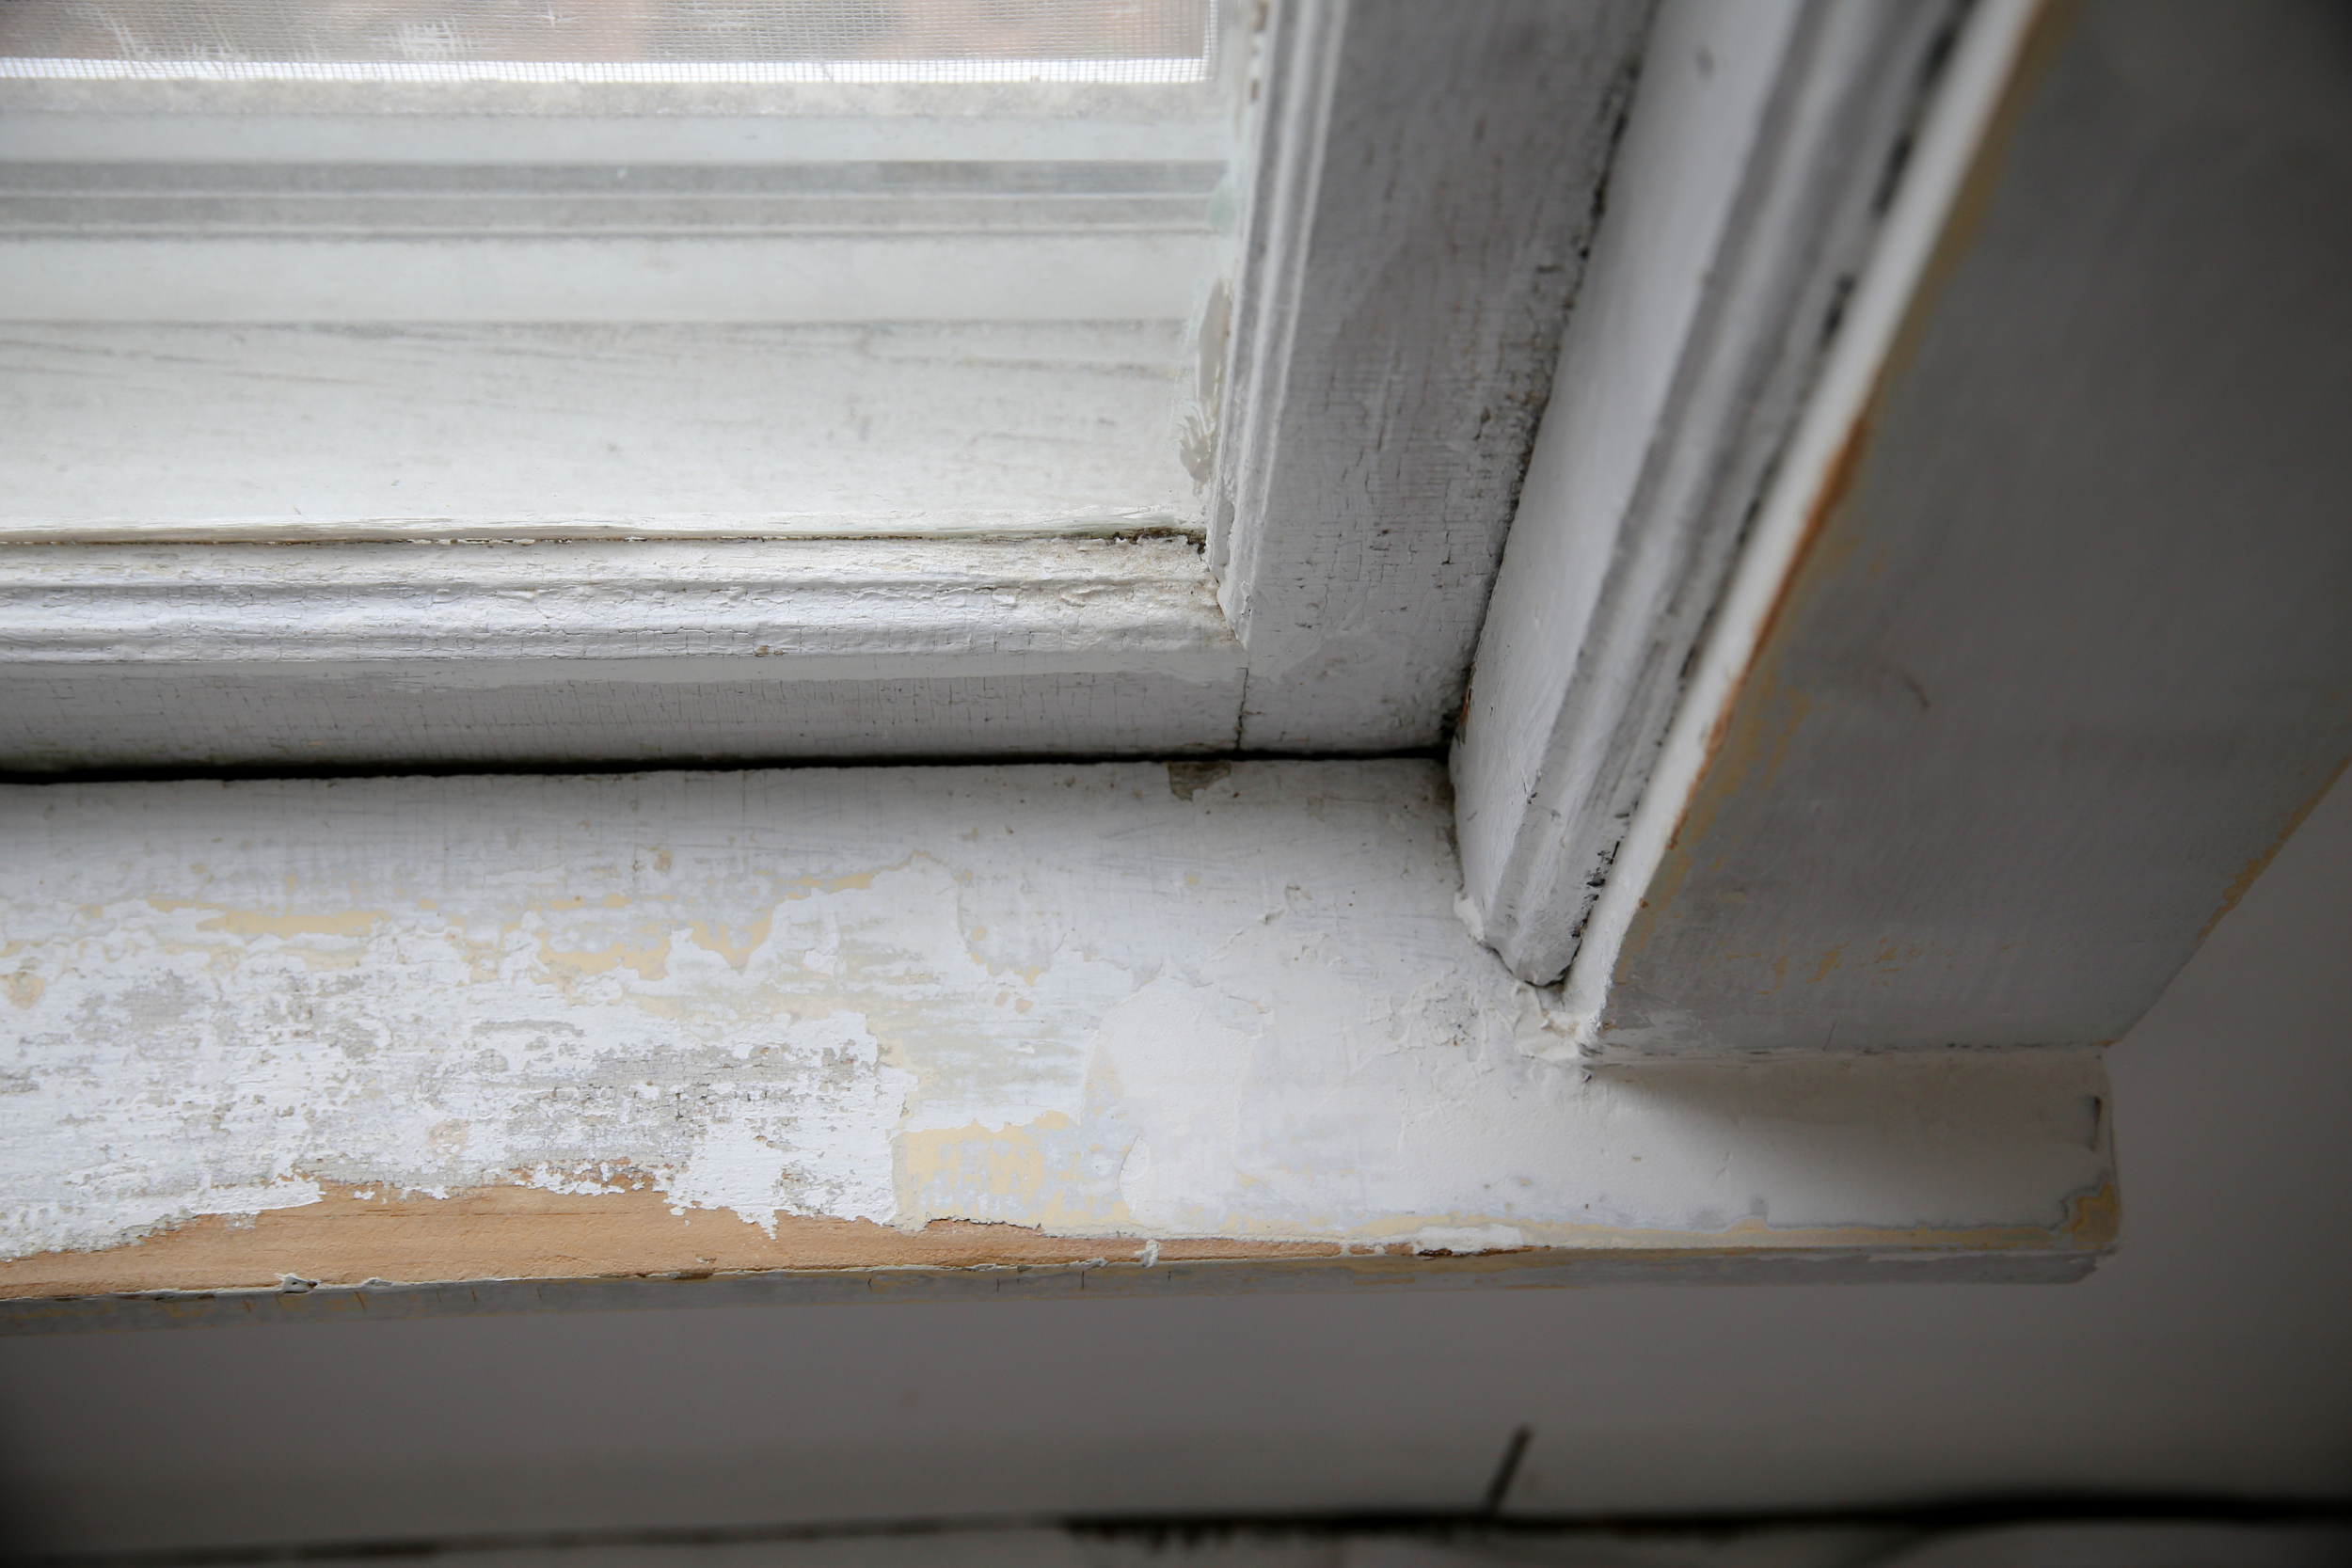
Lancaster experiences high rates of childhood lead poisoning, due in part to its aging infrastructure. Lancaster is an old city with a majority of its homes built before lead paint was banned. Lancaster County has very high prevalence (13.4%) of lead poisoning compared to the state average (3.29%). A recent study found that most cases of lead poisoning were concentrated in Lancaster City, where there is a cluster of old housing stock and renters. There are also non-occupational sources of lead exposure for adults such as the consumption of game meat shot with lead ammunition.
CEC Activities
Lead Remediation
The CEC worked with the City of Lancaster to develop a comprehensive plan for using HUD grant funds to remediate homes in Lancaster. CEC Director, Dr. Marilyn Howarth, has been an advisor on an EPA funded grant evaluating the long-term effectiveness of lead remediation of homes in Lancaster. We are also engaged with Lancaster General Health on the planning and development of outcome metrics for their home remediation program, which is investing $50 million over 10 years to support lead remediation in Lancaster.

Adult Lead Exposure
The CEC has become aware of non-occupational sources of lead exposure for adults such as the consumption of game meat shot with lead ammunition. We are working with the PA-Department of Health (PA-DOH) and rural clinicians to better assess the extent to which eating game meat is contributing to the elevated blood leads among adults and tailor an outreach strategy to address it. The CEC is also assisting the PA DOH in the development and delivery of physician CME on adult lead exposure.

Spanish American Civic Association
In our efforts to better understand and address the environmental health issues facing the Hispanic community we have engaged with the Spanish American Civic Association (SACA). They have expressed enthusiasm for having us address environmental health issues through their radio station and social media.

Our Partnerships in Lancaster
Resources
Explore our resources to find helpful information and programs relevant to the Lancaster community. Visit our Community Resources page to view all our resources.

Legislative Briefing on Lead Poisoning
Legislative briefing on lead poisoning presented to Lancaster City Council on June 20, 2017.
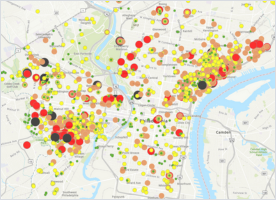
Lead Soil Map
View our resources on lead, including our lead soil map with over 3,900 soil samples representing 86% of census tracts in Philadelphia.
How to Collect Soil Samples for Lead Testing
Written instructions on how to collect soil samples for lead testing.

Lead: It’s Still a Problem (English & Spanish)
Information on lead, the health effects of lead poisoning, and ways to reduce exposure.

Effects of Lead on Children’s Health
Infographic on the effects of lead on children’s health.
Is Your Water Pipe Made of Lead?
Step-by-step guide on how to check if you have lead pipes and ways to reduce exposure to lead through drinking water.

Indoor Air Pollution (English & Spanish)
Information on sources of indoor air pollution in the home and how to reduce health effects from indoor air pollution.
Children and Outdoor Pollution (English & Spanish)
Information on outdoor pollution and the potential health outcomes for asthmatic children.
Get Involved
Do you live or work in this community and would like to get involved with our work? Please contact us!
Contact Us